“The prescription for the cure rests with an accurate diagnosis of the disease.”
—Rev. Dr. Martin Luther King, Jr.
A recent article by the Washington Post fact checker looked closely at the fact that there are 140 million people who are poor or low-income in the U.S. today. While they were clear to say that government data confirms this is an accurate statistic, the article also opened up a debate on how poverty is measured.
For several years, the Kairos Center for Religions, Rights and Social Justice has been examining U.S. Census Data on poverty. Since 2017, and for the Poor People’s Campaign: A National Call for Moral Revival, which we co-anchor with Repairers of the Breach, we have worked with policy institutes and economists to develop an assessment of current measures of poverty – and their limitations – and identify the best measures to understand the state of poverty and economic insecurity in the U.S. today. This includes the Institute for Policy Studies and the Center on Poverty and Social Policy at Columbia University.
Through this collaboration, we have compiled the following resource on why we use the Supplemental Poverty Measure, going up to 200% of the poverty threshold, to measure the state of poverty and economic insecurity in the nation. This is also how the Poor People’s Campaign established that there are 140 million poor and low-income people in this country in 2018.
These numbers must be taken seriously. Despite current efforts by the Trump administration, we cannot hide these numbers behind restrictive definitions or measurements of poverty. And there are life-threatening consequences to minimizing these definitions, including 300,000 children and 250,000 adults losing access to health care.
TWO MEASURES OF POVERTY: THE OFFICIAL POVERTY MEASURE AND THE SUPPLEMENTAL POVERTY MEASURE
The U.S. Census provides two different measures of poverty: the official poverty measure (OPM) and the supplemental poverty measure (SPM).
The OPM was developed in 1963 and is based on income and food expense data from 1955. At that time, a poor family of 3 or more was found to spend about 1/3 of its income on food. While the OPM has been updated to account for inflation based on the Consumer Price Index, it does not account for how household expenses have changed relative to the costs of food. The OPM still assumes the basic formula – that households spend 1/3 of their income on food – but it does not reflect current patterns of household spending, including how rent, health care, gas, or other common household expenses have changed since 1955.
In 1995, the National Academy of Sciences recommended a new measure for estimating poverty in the United States.[1] The result has been the development and U.S. Census Bureau publication (since 2011) of the Supplemental Poverty Measure (SPM). The SPM accounts for family income after taxes and transfers, and as such, it shows the antipoverty effects of some of the largest federal support programs, including the Supplemental Nutrition Assistance Program (food stamps/SNAP) and the Earned Income Tax Credit (EITC). It also takes into account critical out-of-pocket expenses for food, clothing, housing, and utilities, and is adjusted by geography as well as housing tenure (whether you are a homeowner, mortgage-holder, or renter).[2]
As a comparison of the two measures:
- In 2017, the poverty threshold under the OPM was $24,858 for a 4-person household.
- Under the SPM, the poverty threshold for a 2-adult, 2-child household ranged from $19,583 to $39,750 depending on your geography, whether you were a renter or homeowner and whether or not you had a mortgage.
Poverty indicators are always estimates of some underlying conditions of income hardship that are difficult to observe. This means that these measurements are, to some degree, always limited. However, the SPM is the measure of choice by poverty researchers.[3] In 2019, the National Academies consensus report on reducing child poverty by half specified the SPM as the metric for evaluating potential policies.[4]
THE DIFFERENCE BETWEEN POOR AND LOW INCOME
Although a broader and preferred measure, the SPM poverty threshold still remains an incomplete estimate of poverty. For instance, according to the SPM, a four-person household with an income of $30,000 is not poor because they fall above the designated poverty threshold. This means that many households living just above the poverty threshold aren’t counted as poor, even though they will have a hard time meeting their basic needs.
Instead, the population living between 100-199% of the poverty threshold is sometimes defined as “low-income.”[5] They are both living just one emergency, traffic violation or health care crisis away from being poor and most likely will fall under that poverty threshold – and into poverty – over the course of the year. This is why the 2019 National Academies’ consensus report also makes reference to families with incomes below 200 percent of the SPM poverty threshold as a group to look at closely when considering economic insecurity.[6]
The distinction between those who fall below the threshold and those who fall right above it is arbitrary for those who are living in economic insecurity. For this reason, we include everyone living under 200% of the SPM poverty threshold to estimate poverty and economic insecurity.
According to the SPM from 2017, 43.5% or 140 million people are poor or low-income in the US today.[7] This breaks down into the following demographics:[8]
- 52.1% or 38.5 million children (below 18)
- 42.0% or 21 million elders (above 64)
- 41.6% or 65.8 million men
- 45% or 74.2 million women
- 59.7% or 23.7 million Black, non-Hispanic people
- 64.1% or 38 million Latinx people
- 40.8 or 8 million Asian people
- 58.9% or 2.14 million Native/Indigenous people
- 33.5% or 65.6 million White, non-Hispanic people
A similar statistic came out of the 2018 Federal Reserve Report on the Economic Well-Being of U.S. Households, finding that 40% of adults in this country could not afford a $400 emergency.[9]
The SPM does not account for other household expenses like indebtedness, medical needs or insurance costs and is still an underestimate of the true population of poor and low-income people in the nation. We need a broader, more accurate measure to truly capture the extent of economic insecurity and develop programs and policies in response. As Rev. Dr. Martin Luther King said in 1967, only with an accurate diagnosis of the disease will we be able to identify an adequate cure to this crisis.
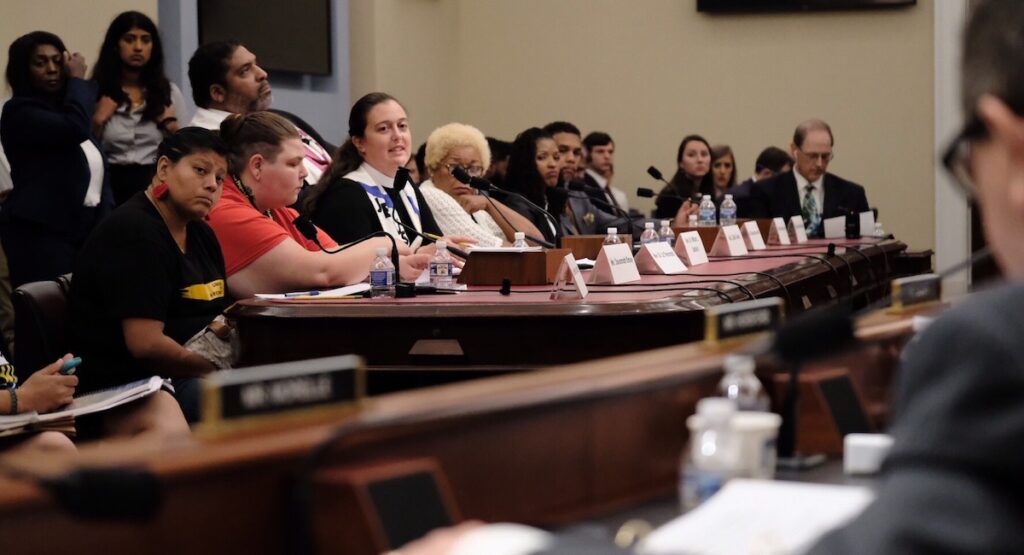
[aesop_image img=”https://kairoscenter.org/wp-content/uploads/2019/06/IMG_0132.jpg” panorama=”off” credit=”Steve Pavey” align=”center” lightbox=”on” captionsrc=”custom” caption=”Speakers and witnesses from the Poor People’s Campaign at the House Budget Hearing on Poverty in the US.” captionposition=”left” revealfx=”off” overlay_revealfx=”off”]
[1] Citro, Constance F., and Robert T. Michael, eds. 1995. Measuring Poverty: A New Approach. Washington, DC: National Academy Press. https://www.nap.edu/catalog/4759/measuring-poverty-a-new-approach.
[2] Fox, Liana. 2017. “Anchored and relative: Supplemental thresholds for the SPM,” Working paper SEHSD-WP2017-50, U.S. Census Bureau. https://www.census.gov/library/working-papers/2017/demo/SEHSD-WP2017-50.html; Johnson, David S., and Timothy M. Smeeding. 2012. “A consumer’s guide to interpreting various U.S. poverty measures,” University of Wisconsin-Madison Institute for Research on Poverty, Fast Focus (14) May 2012. https://www.irp.wisc.edu/publications/fastfocus/pdfs/FF14-2012.pdf.
[3] Fox, Liana. 2018. “The Supplemental Poverty Measure: 2017,” Report P60-265, U.S. Census Bureau. https://www.census.gov/library/publications/2018/demo/p60-265.html; Hutto, Nathan, Jane Waldfogel, Neeraj Kaushal, and Irwin Garfinkel. 2011. “Improving the measurement of poverty,” Social Services Review, 85 (1): 39-74. https://www.journals.uchicago.edu/doi/10.1086/659129;
[4] Duncan, Greg, and Suzanne Le Menestrel, eds. 2019. A Roadmap to Reducing Child Poverty. Washington, DC: The National Academies Press. https://doi.org/10.17226/25246.
[5] Duncan, Greg, and Suzanne Le Menestrel, eds. 2019. A Roadmap to Reducing Child Poverty. Washington, DC: The National Academies Press. https://doi.org/10.17226/25246. See also, Halfon, Neal, Kandyce Larson, John Son, Michael Lu, Christina Bethell. 2017. “Income inequality and the differential effect of adverse childhood experiences in US children,” Academic Pediatrics, 17 (7): S70-S78. https://doi.org/10.1016/j.acap.2016.11.007; Hardy, Bradley, Timothy Smeeding, and James P. Ziliak. 2018. “The changing safety net for low-income parents and their children: Structural or cyclical changes in income support policy?” Demography, 55 (1): 189-221. https://doi.org/10.1007/s13524-017-0642-7; Jiang, Yang, Mercedes Ekono, and Curtis Skinner. 2016. “Basic facts about low-income children: Children under 18 years, 2014,” Fact sheet, National Center for Children in Poverty, Mailman School of Public Health, Columbia University. https://www.nccp.org/publications/pub_1145.html; Wimer, Christopher, Sophie Collyer, Irwin Garfinkel, Lauren Kennedy, Matthew Maury, Kathryn Neckerman, Julien Teitler, and Jane Waldfogel. 2018. “The state of poverty and disadvantage in New York City,” Report, Poverty Tracker: Monitoring Poverty and Well-Being in NYC, Robin Hood Foundation. https://robinhoodorg-production.s3.amazonaws.com/uploads/2018/12/PT_ANNUAL_12.19.pdf.
[6] Duncan, Greg, and Suzanne Le Menestrel, eds. 2019. A Roadmap to Reducing Child Poverty. Washington, DC: The National Academies Press. https://doi.org/10.17226/25246;
[7] https://www.census.gov/content/dam/Census/library/publications/2018/demo/p60-265.pdf; https://ips-dc.org/supplemental-poverty-measure/
[8] These numbers were developed with the Center on Poverty and Social Policy at Columbia University using early release data provided by the Census and the public-use version of the 2018 Current Population Survey’s Annual Social and Economic Supplement (referencing income and poverty in 2017). Final release data may have some minor changes. https://www.census.gov/content/dam/Census/library/publications/2018/demo/p60-265.pdf
[9] https://www.federalreserve.gov/publications/files/2017-report-economic-well-being-us-households-201805.pdf