Sara Fearrington of the Fight for $15 has six kids and worked at a Waffle House before she was laid off during the pandemic. At a press conference organized by the Poor People’s Campaign, she explained why she is voting this year, for the first time, in a Presidential election:
“I’ve worked hard all my life. I’ve had a job since I was seven, had two jobs in high school and then went from being in the medical field to not being able to find a job to working in a restaurant and now being out of work in the pandemic…I have a sick husband. I have children with asthma. I’m working as hard as I can, but I’m still broke. Why am I not included in the bigger picture? None of this is my fault and my voice needs to be heard. I was raised by a good, conservative, beautiful Republican family that taught when you plant a seed, it will grow into something. So, I’m going to plant myself into this economy and with other people going through the same things I am. And I’m coming for my politicians. I’m coming forward to say, ‘If you’re not going to pay attention to me, I’m going to make you pay attention, because I’m here, I’m here for a good reason and my vote matters.’”
If you’re not going to pay attention to me, I’m going to make you pay attention, because I’m here, I’m here for a good reason and my vote matters.
Sara Fearrington, Fight for $15
Sara is one of approximately 63 million poor and low-income people who are eligible to vote in this country. According to a new report from the Poor People’s Campaign, 34 million of these eligible voters did not vote in 2016. Much like Sara, they are mainly concerned about their family’s health and economic well-being, but they have not seen their lives or issues adequately represented in our nation’s politics. In the lead up to the 2016 election and even in this year’s contests, there has not been a single hour of prime-time political debate dedicated to their concerns.
Their absence from the political narrative comes alongside a new era of voter suppression tactics that target poor and minority voters. Since 2008, these tactics have been implemented in dozens of states across the country. At 34 million and counting, poor and low-income eligible voters have been deliberately disorganized out of the political arena.
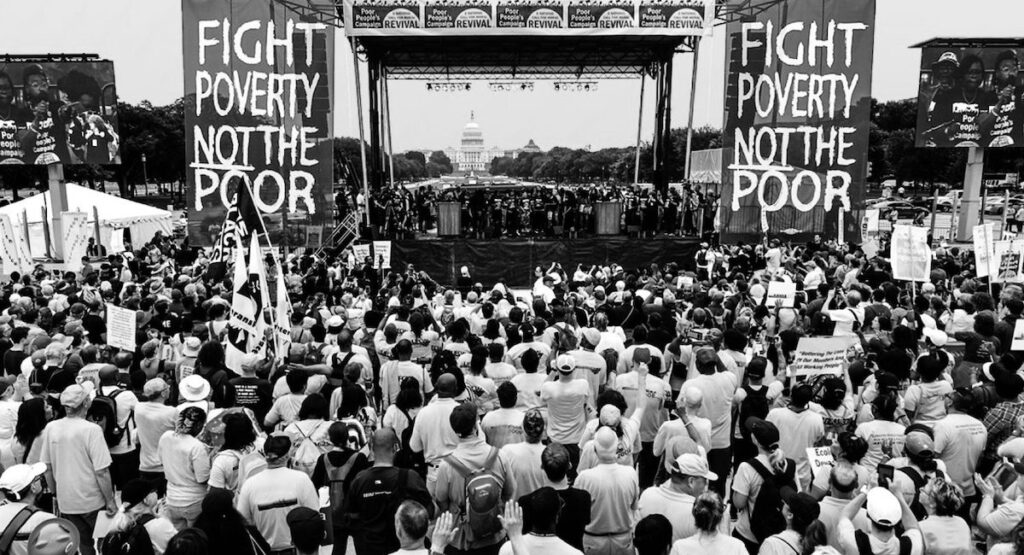
This month’s policy briefing traces the modern dismantling of the right to vote, especially as it relates to poor and low-income voters, and how these same voters are also the key to rebuilding our democracy. Indeed, Sara and other low-wage and unemployed workers are organizing to make sure their voices are heard — in a crisis in which their concerns are increasingly becoming everybody’s concerns. If they get organized into a movement that is grounded in an agenda based on their needs, this segment of voters could reorient our nation’s politics and resources towards securing the health and economic well-being of us all.
Voter Turnout in the 2020 Primaries
Before the pandemic, voter turnout for the 2020 primary season was on track to surpass turnout in 2016. There were over 3 million more votes cast in the January 2020 Super Tuesday Democratic primaries than in 2016. This remained true for the next wave of primary contests in early March. In fact, looking at the sum total of primary voters in 2020, there were 1 million more votes cast this year than in the Democratic primaries of 2016.
While this turnout is remarkable, especially given the obstacles to voting this year, looking at the aggregate number alone conceals decreases in voting that occurred at the state level: 13 states saw a drop in their turnout from 2016. The pandemic offers one reason for this decline in voter turnout, but it does not explain why California and Oklahoma also experienced this drop. They both held their primaries in January, before COVID-19 became a public health crisis.
Notwithstanding the unique circumstances of the pandemic, the problem lies with using 2016 as the baseline. That was the first election year after the Supreme Court struck down the preclearance provision of the Voting Rights Act. By the 2016 Presidential election, 14 states had new voting restrictions in place for the first time and there were approximately 100 million eligible voters who did not vote that year. Using 2016 as the reference point for 2020 underestimates potential voter turnout.
Compared to 2008, Super Tuesday turnout was down by nearly 2 million votes across 9 states in 2020 … With the exception of Nevada, all of these states had also passed some form of voter suppression law since 2008.
Instead, using 2008 as a reference point shows that there were 5.6 million fewer votes cast in the 2020 primaries. Some of this is, again, due to COVID-19 and failures to institute safe voting procedures. In the contests that were held between April and July, 15 states saw a decline in their voter turnout from 2008. And still, the pandemic does not explain the decreases that occurred before April. Compared to 2008, Super Tuesday turnout was down by nearly 2 million votes across 9 states in 2020: Iowa, Nevada, Alabama, Arkansas, California, North Carolina, Oklahoma, Tennessee and Texas. Turnout was also down in Mississippi, Missouri, and North Dakota, which all held their elections in early March, before the national lockdown.
With the exception of Nevada, all of these states had also passed some form of voter suppression law since 2008. Whatever happened that year precipitated the worst attacks on the right to vote since the Voting Rights Act was passed in 1965.
The “Obama Coalition” and a New Wave of Voter Suppression
In 2008, people who had never voted before were showing up at the polls. Precincts were routinely running short on ballots, poll hours were being extended and voters were packed inside community centers and churches to participate in the Democratic primaries. Crowd sizes were often described as “staggering,” “record breaking,” and “unprecedented.” This high turnout was mainly attributed to excitement generated by the first viable Black and woman Presidential contenders. For many, these candidates represented a signal that actual change was possible. The Washington Post reported one Virginia voter’s observation that the election was, “like the World Series. There’s excitement about the fact that it’s so close and both candidates are different from anything we’ve seen in the past. It’s just not the same old, same old.” This hope for change was paralleled at the ballot box. The Super Tuesday turnout of 27 percent of eligible voters broke the record of 25.9 percent set more than three decades earlier in 1972.
These record numbers received their due attention; however, it was the coalition of voters that was the real breakthrough in 2008. The Obama campaign’s shrewd organizing model identified counties and districts that could build a new electorate in the country. And it worked. Known as the “Obama Coalition,” a wide constituency was brought together that year: white voters without a degree in the Midwest and West Coast were voting for the same candidate as Black southerners and Hispanic youth. This organizing model both brought in new voters and contributed to the most diverse electorate in the country’s recent history.
The Obama Coalition was also attacked from the very start. As the Brennan Center for Justice documented, voter suppression tactics began surfacing just a few months before the general election. They included “no match, no vote” laws that would prevent people from voting if their information was inconsistent across government databases; purges of voter rolls; challenges to voter eligibility; technical barriers; barriers to student voting and more.
The attacks on voting rights did not subside after the elections. Following the 2010 midterms, when Republicans gained a majority in the House of Representatives and in state governorships, restrictions on voting rights continued in the states. Aided in part by conservative-funded organizations like the American Legislative Exchange Council (ALEC), in just one year 38 states introduced legislation designed to make it harder to vote.
Then, in 2013, the Supreme Court gutted the Voting Rights Act in Shelby County v. Holder by removing its preclearance requirement. The decision allowed for states and jurisdictions to change their voting laws without any supervision from the Department of Justice, even in those places that had well-recorded histories of voting rights abuses. The Shelby decision precipitated another wave of voter suppression laws in at least 27 states that have systematically targeted Black, Hispanic, Indigenous and poor communities. This has come alongside at least 1700 closures of polling stations, making it harder for potential voters to participate in elections, especially people with disabilities and anyone with designated work hours, limited breaks and inadequate access to reliable public transportation.
These laws had a profound impact on voter turnout in the elections that followed. In 2012, the Hispanic vote dropped by over two percentage points; by 2016 the Black vote had fallen by more than five percentage points. Also in 2016, the number of voters with household incomes less than $50,000 fell by 5.3 million voters from 2008. The coalition that came together in 2008 had been systematically dismantled.
The Untapped Potential of Poor and Low-income Americans
In 2019, the Knight Foundation released a groundbreaking study looking at the preferences and characteristics of the 100 million eligible non-voters in this country. The report helped explain how the Obama Coalition, as well as Donald Trump, were able to win certain states by mobilizing just a segment of those non-voters. In spite of the record turnout in 2008, their victories relied on targeted outreach to particular blocs within those millions of non-voters.
A new report from the Poor People’s Campaign takes a closer look at one of the largest segments of non-voters in the country: poor and low-income eligible non-voters. Among the 225 million eligible voters in 2016, approximately 63 million were poor or low-income, with household incomes of less than twice the federal poverty line. Of these 63 million low-income voters, only 29 million voted. This means that 34 million poor and low-income people did not vote in 2016.
There are valid reasons why these eligible voters do not vote: the issues they care about most, namely health and economic well-being, are not represented on the political agenda and many feel like their vote will not make a difference. Disability access and lack of transportation also play a greater role in determining their participation than they do with higher-income voters. The report acknowledges the role that voter suppression plays in lower participation rates among poor and low-income voters, as well.
Importantly, it also shows that the participation rates among low-income voters change and can even increase over time. The report goes even further, showing that small increases in their turnout could change election outcomes in 2016 and 2018, including in key battleground states in the Midwest and the South.
Below is an interview with the author of this report, Robert Paul Hartley, Ph.D., an economist and assistant professor of social work at Columbia University. As he makes clear, what is at stake in November is when and how the issues of the 140 million poor and low-income people in this country will become part of the political agenda.
Come November, we must vote like our lives depend on it, because they do. And the very next day, we must continue to build the power of the 140 million, not to ensure the victory of any one political party, but to guarantee that the priorities and agenda of the poor secure their rightful place in this democracy and our nation’s politics.
Among the 225 million eligible voters in 2016, approximately 63 million were poor or low-income … Of these 63 million low-income voters, only 29 million voted. This means that 34 million poor and low-income people did not vote in 2016.
Shailly Gupta Barnes: Rob, we’ve worked with you before on the Campaign’s measures and definition of poverty and again on this report on poor and low-income voters. How did you develop your interest and expertise in these research areas?
Rob Hartley: I grew up in southern Georgia and my heroes were people like Martin Luther King, Jr., Andrew Young and John Lewis. They were Georgians, they were ministers and they were concerned about economic justice. They really defined what I wanted my career to be about, so I pursued that through the campus ministry at Georgia Tech and all of my ministry opportunities were connected to working with and living among poor and low-income people. I had been working at an elementary school that had really high rates of poverty, low levels of reading ability at grade level and began thinking about what kind of policy environment these kids face. That intersection of poverty and policy was what drove me to study economics at the University of Kentucky.
SGB: And how did you become involved with the Campaign?
RH: After finishing my Ph.D., I came to New York to work at the Center on Poverty and Social Policy at Columbia University. I actually had your name from one of the Campaign’s reports and I thought, “This is the person I should meet when I get to New York.” I was even thinking about how my work around poverty could support the Campaign — I actually work in the dataset that you use to measure and define poverty. When we moved, my family and I, we joined Riverside Church and became involved with their work on the Poor People’s Campaign. We would show up to events and march and help make signs. One day, I looked at my wife’s phone and it had your name on it, because the two of you had a playdate. Our kids had met making signs at a Campaign event. And it just all pieced together.
SGB: I love how the Campaign brought us together. In the policy work of the Campaign, we approach economics and faith as complementary, that what is morally right is also economically sound. Do you share that belief?
RH: Yes, actually as an undergraduate, I thought economics was mainly about business and had no interest in it. I had to take one economics class and got a C in it. What drew me back to economics was realizing how influential it is in shaping the policies that affect people’s lives. I do try to see myself as a good economist, in that I try to approach everything using economic tool sets without bias, but I am very interested in the human outcomes of the research I do. One way to approach data in an “unbiased” way is to just let the data speak for itself, but data doesn’t say anything on its own. As an economist and researcher, I have to think about the issues people are facing and how we model some way of empirically estimating how policy affects their lives. I actually see the application of economics to the field of social work almost like practical theology.
One of the things that I really liked about getting into this report on low-income voters is that I’m often thinking about how specific policies affect people living in poverty. This report gave me the opportunity to really think about how those living in poverty are able to participate in this process of shaping policy.
SGB: What are some of the key findings from this report?
RH: I tried to focus my research questions on: how much are people voting by income status, how do their numbers relate to the total electorate and how much would it matter if the low-income electorate were to vote more. The first thing I looked at was the trends in voting rates over time. While low-income individuals are about 20 percentage points less likely to vote than higher-income voters, the trends in these two income groups move together, up and down, over decades. You can see in the 2018 election, there’s about a 10 percentage points increase for both low-income and high-income voters, indicating that the reason low-income folks aren’t voting isn’t because they are apathetic to what’s happening. Their participation can increase and, just like higher income voters, they want to see their issues reflected in the political discussion and agendas.
Next, I took the number of low-income non-voters as a percentage of all people eligible to vote to see how big this group is in relation to the total electorate. In a lot of states, they are about one-fifth of the total electorate. And these numbers are fairly conservative, because we’re using a definition of low income that is below 200% of the official poverty threshold. In my research, I typically use the supplemental poverty threshold which would show that even more of the electorate is made up of low-income non-voters.
I then looked at how large this group is relative to recent victory margins. If you consider the 2016 presidential election there are some states with very small margins of victory — just 1% of low-income non-voters would be equal to the margin of victory in Michigan. In states like Pennsylvania or Florida it might be 4–7% of low-income non-voters that are equal to recent margins. This indicates that this population could matter in determining election outcomes.
So, the next question was, “Well, what would it take to change the outcome for a state?” I estimated what percent of new low-income non-voters, if they voted at the same rate as higher-income voters, would it take to change the outcome. It would have to be greater than fifty-fifty, because new voters on one side would neutralize voters on the other. In Michigan, all it would take is 51% of new low-income non-voters, voting at the same rate as higher income voters, to change that election outcome in 2016. This is just a small simple majority. In Pennsylvania, it would be 55%. But even in states that have histories of voter suppression, like North Carolina, Florida, Georgia, we can see potential changes in election outcomes with these new low-income voters. These states used to be covered by the pre-clearance provision of the Voting Rights Act, but even those states with histories of voter suppression are showing up as states that could potentially turn if low-income voters were participating at higher rates. In total, there are fifteen states that could possibly flip, ten of them Republican, five Democrat, in 2016 given higher turnout among new low-income voters.
In total, there are fifteen states that could possibly flip, ten of them Republican, five Democrat, in 2016 given higher turnout among new low-income voters.
SGB: Can you tell us more about why this large bloc of potential voters, 34 million people, do not vote?
RH: Lower-income voters are more likely to not vote because of illness or disability, while higher-income people are more likely to not vote because they’re traveling or out of town. But just like higher-income voters, lower-income people would vote if they think that their vote matters or the candidates are speaking to them.
SGB: I interpret this to mean that we have a responsibility to make sure the interests of poor and low-income voters are reflected in the political agendas and that if and when that happens, they will participate in elections. And that can change what happens.
RH: Yes, in our very rich and prosperous nation, we really don’t stand by poor and low-income people as much as we could. I’ve sat at conferences where we argue over what poverty measurement to use and whether we’ve eliminated poverty or not. And I go to these events and think, “people have no idea why poverty exists.” As an economist, what drives me is knowing that my research adds value and respects the dignity of poor people. This is what I’ve tried to do here and I think the report shows why it’s important to focus the country’s attention on engaging poor and low-income voters.